I turn messy data into clear decisions. Armed with SQL, Python, Power BI & Tableau — I've built 15+ real-world projects from scratch. Fresher. Self-taught. Ready to contribute from Day 1.
Core technical skills I use daily to extract insights and build data-driven solutions.
Real-world data analysis projects delivering measurable business impact.
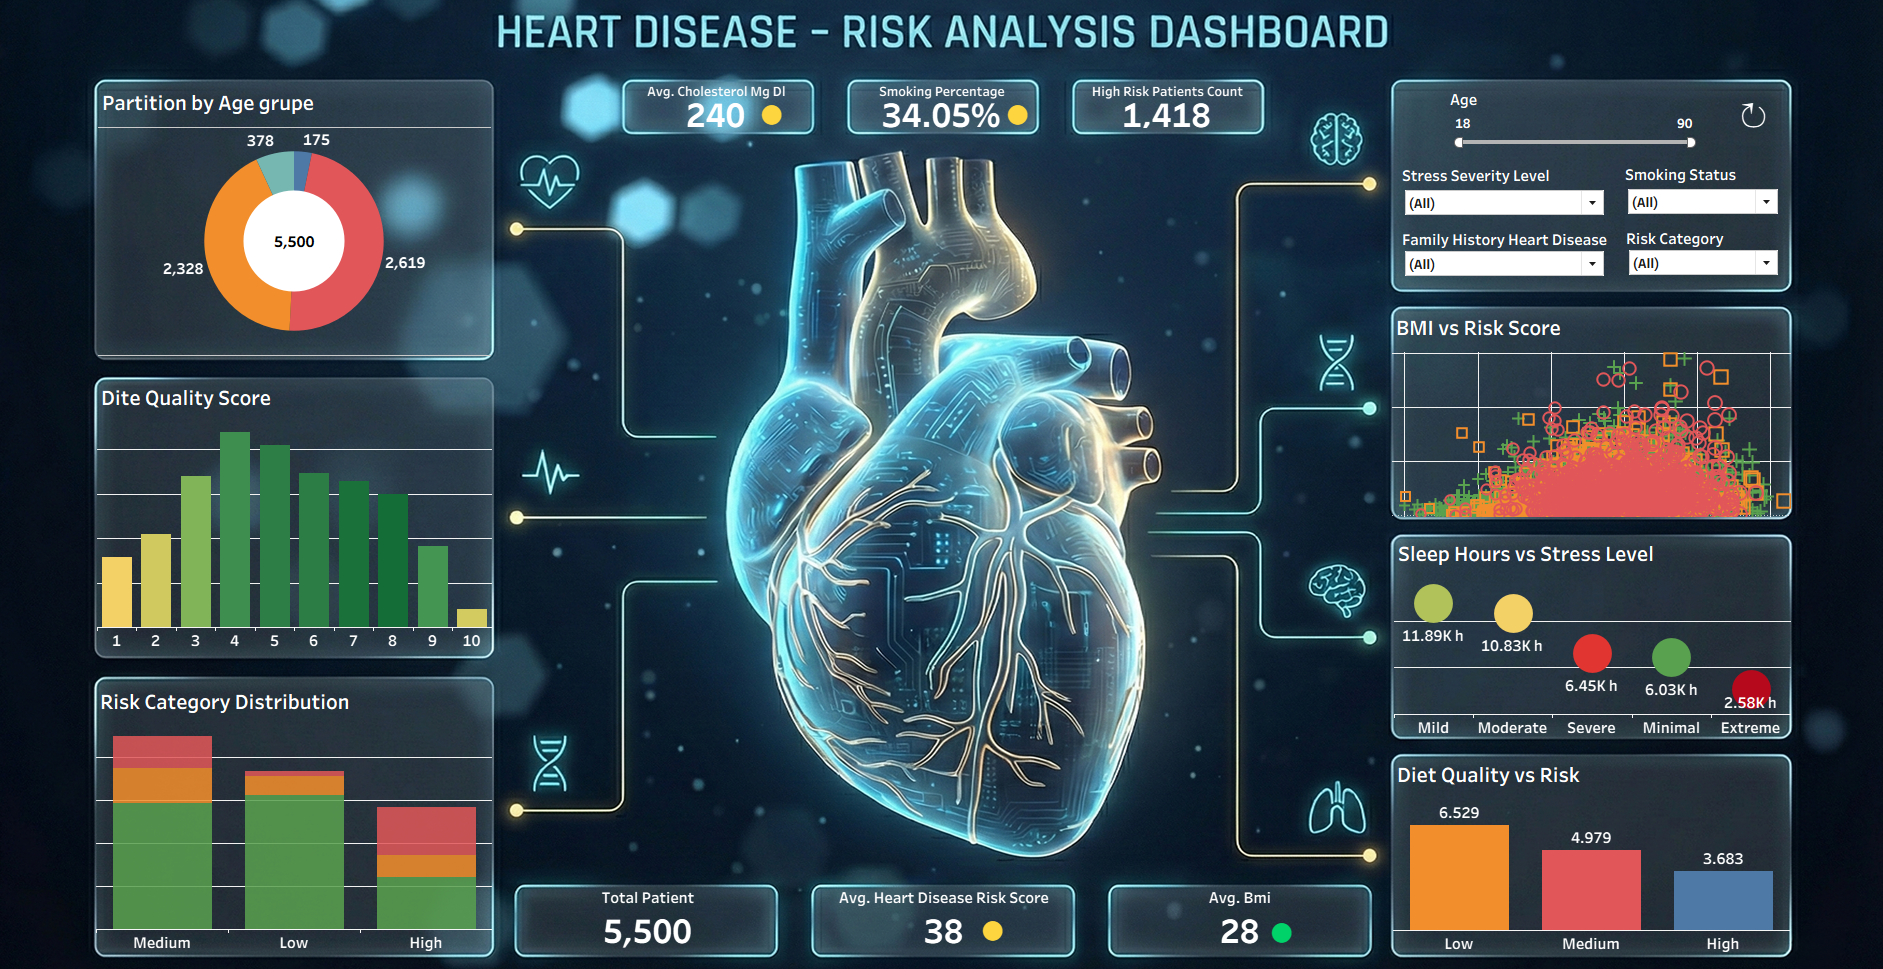
An interactive Tableau dashboard analysing key risk factors for heart disease — including age, cholesterol, blood pressure & chest pain type — to help identify high-risk patient profiles.
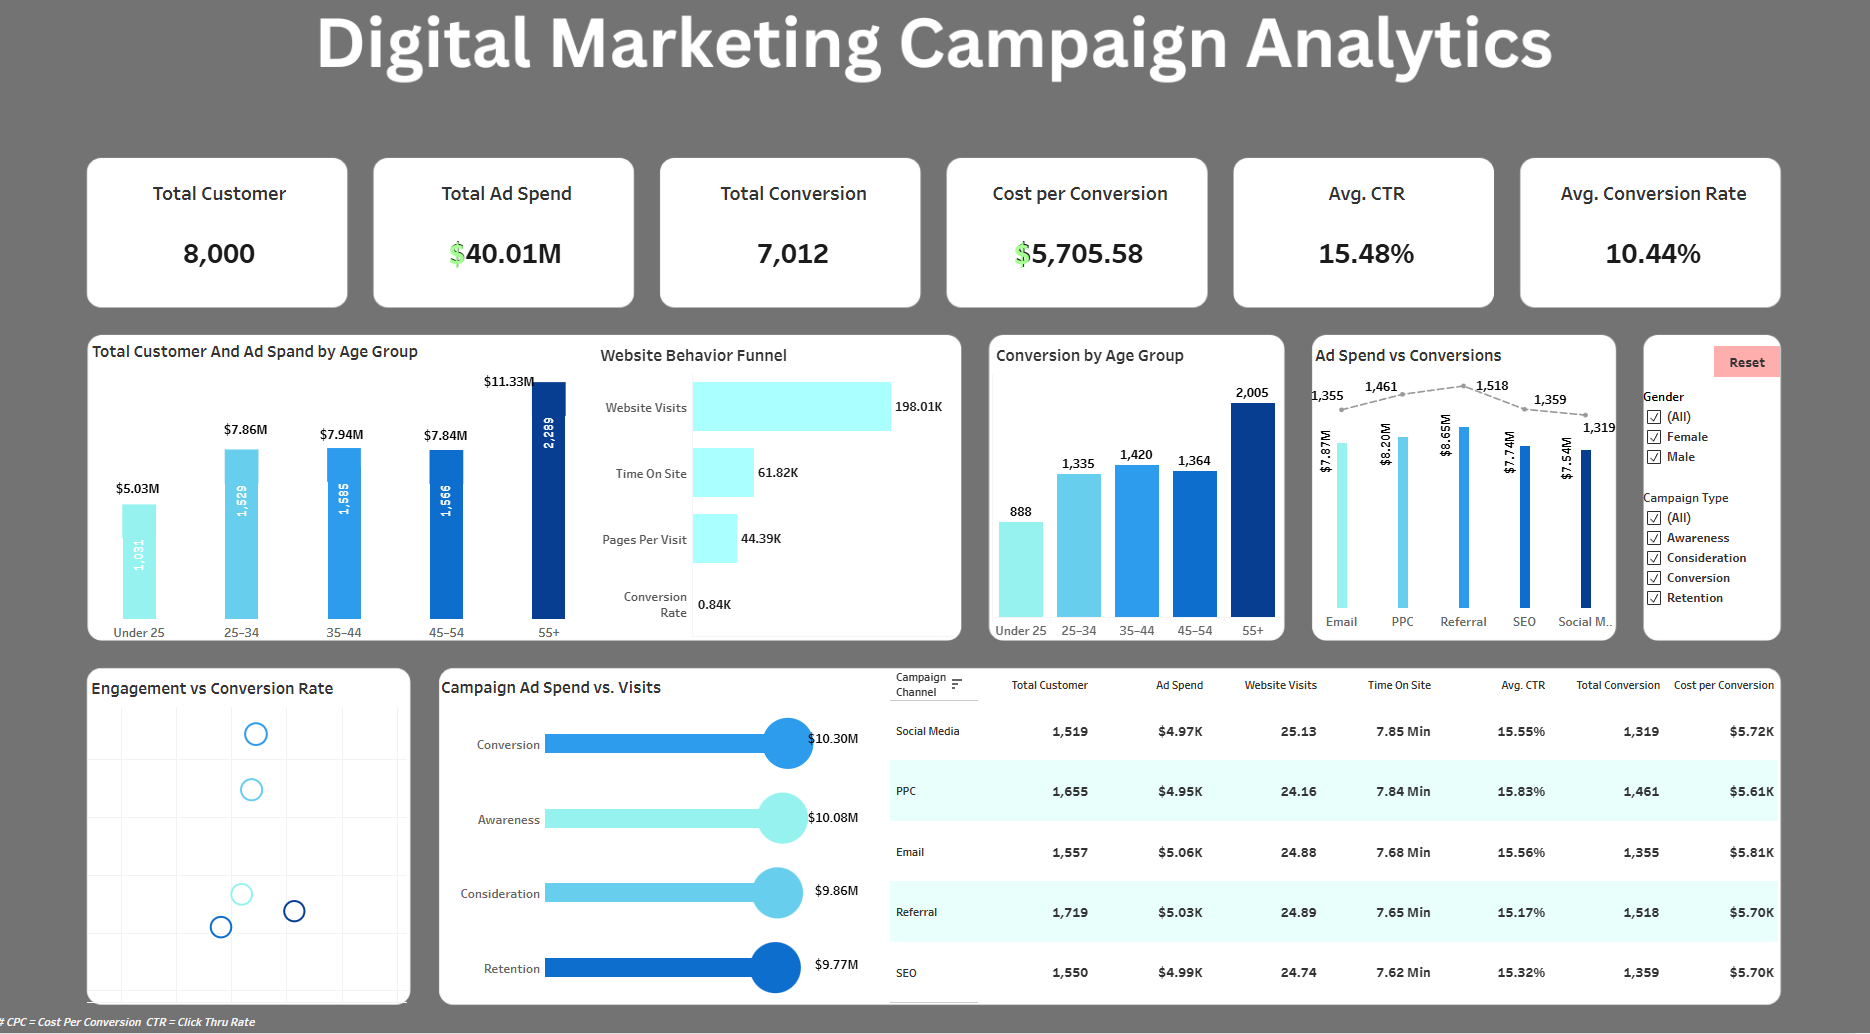
An interactive Tableau dashboard tracking campaign performance — analysing clicks, conversions, ROI, and channel effectiveness to help optimise digital marketing spend.
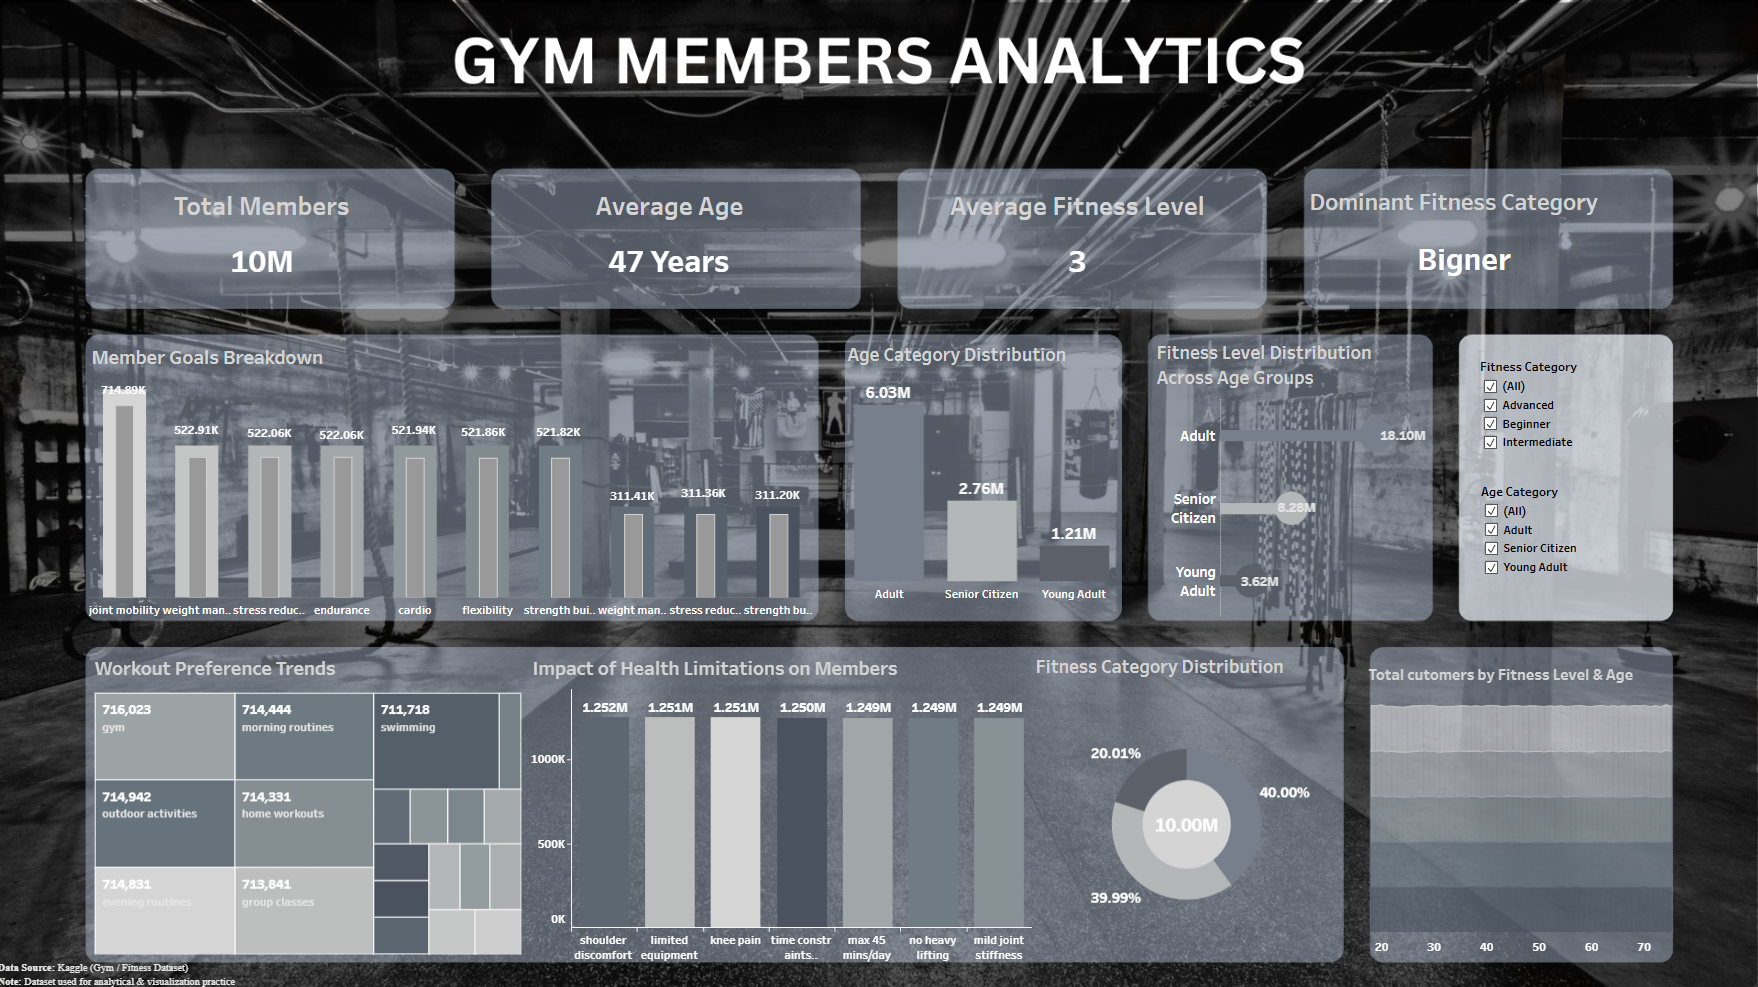
An interactive Tableau dashboard analysing gym membership data — tracking member activity, workout frequency, retention trends, and fitness goal attainment across different demographics.
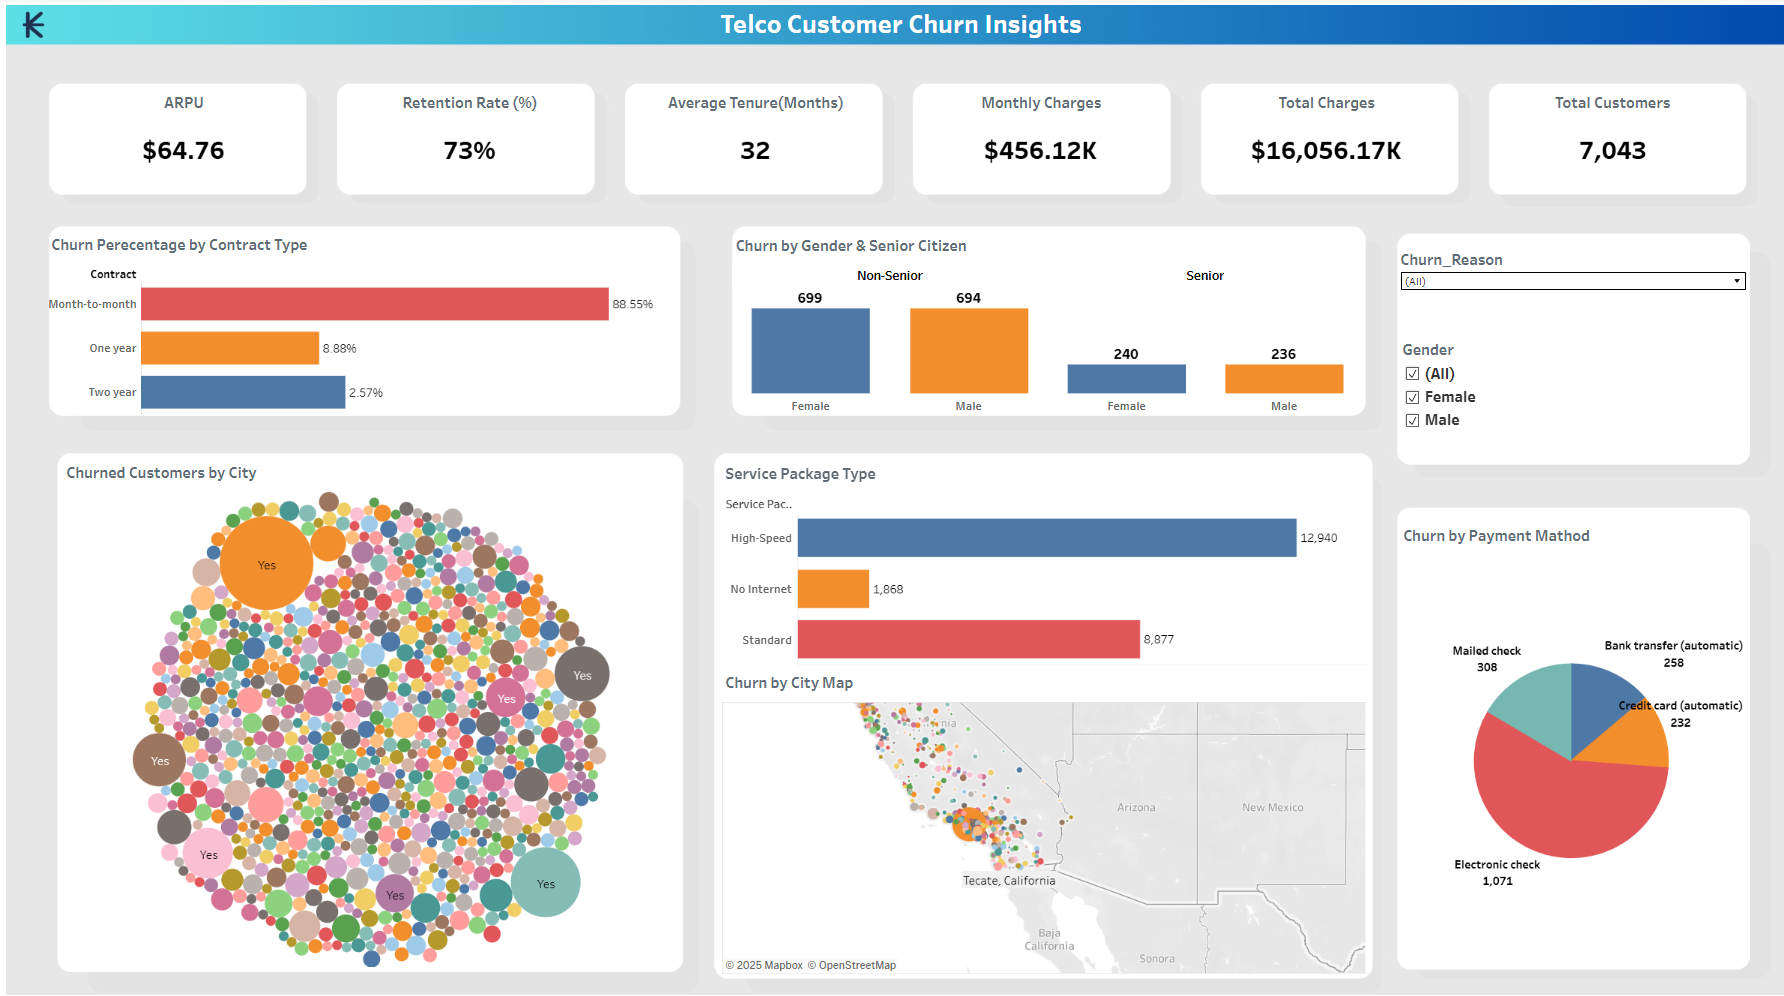
A Tableau dashboard exploring telecom customer churn patterns — identifying key drivers like contract type, tenure, and service usage to help reduce customer attrition.
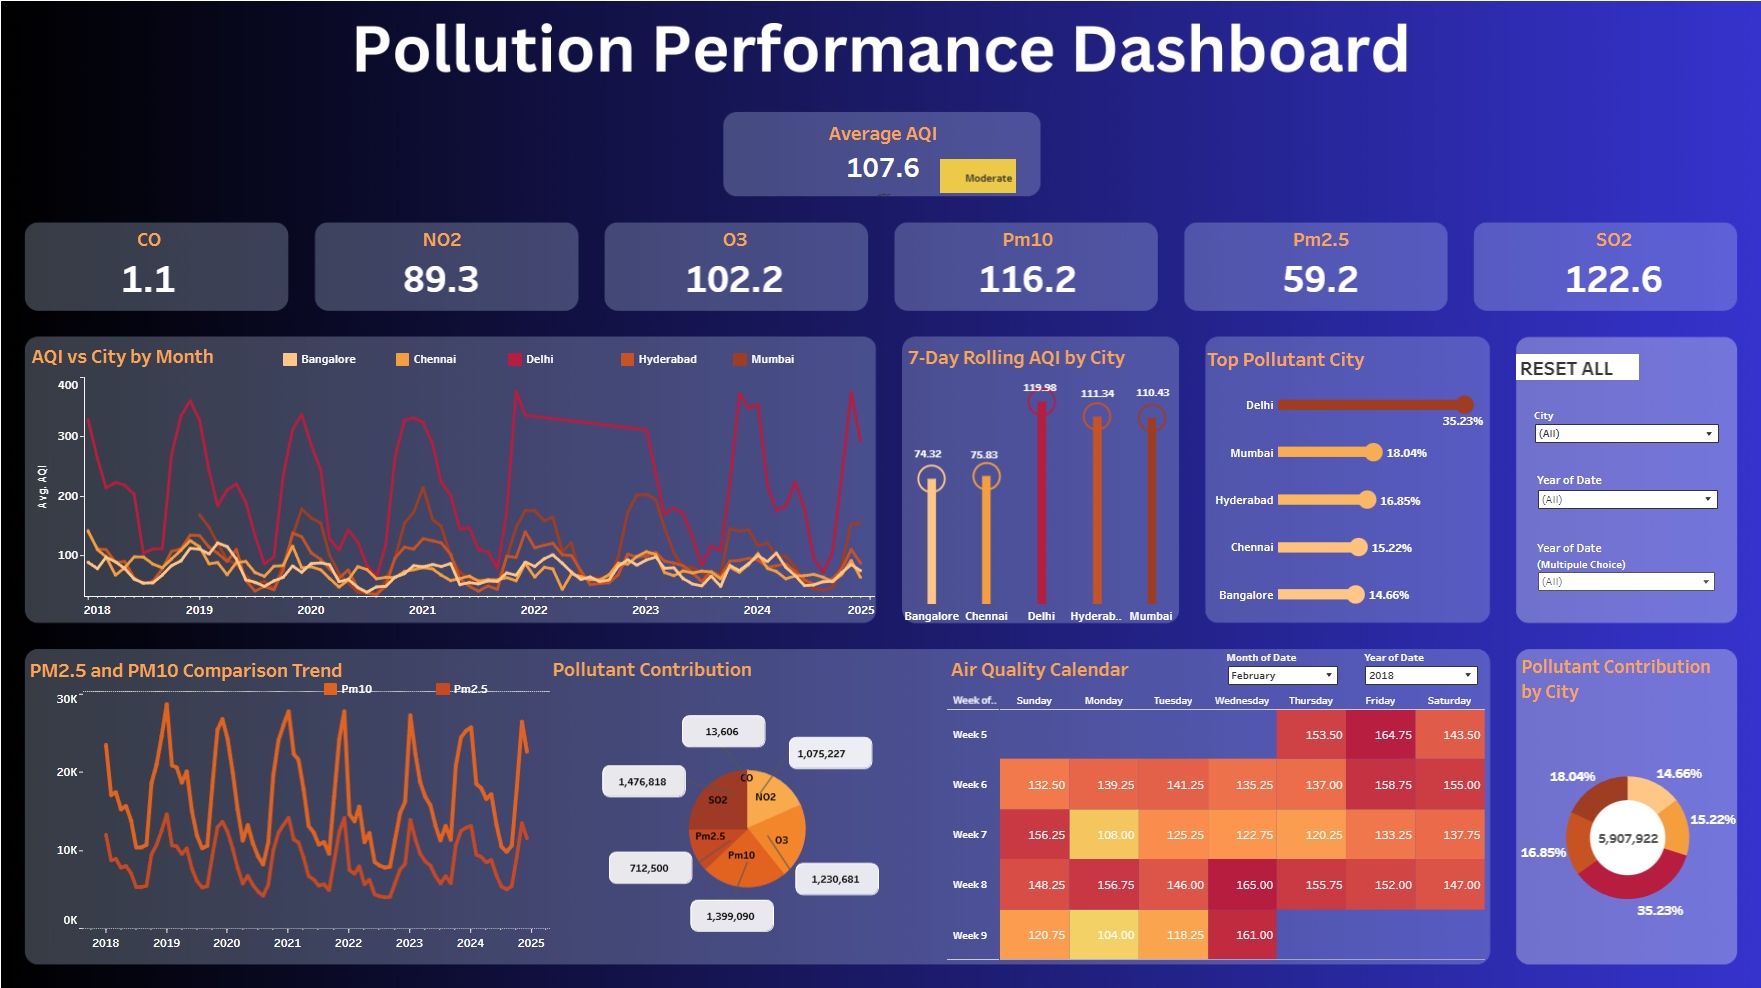
An interactive Tableau dashboard visualising pollution levels and environmental performance metrics — tracking air quality, emission trends, and regional comparisons to support data-driven sustainability decisions.
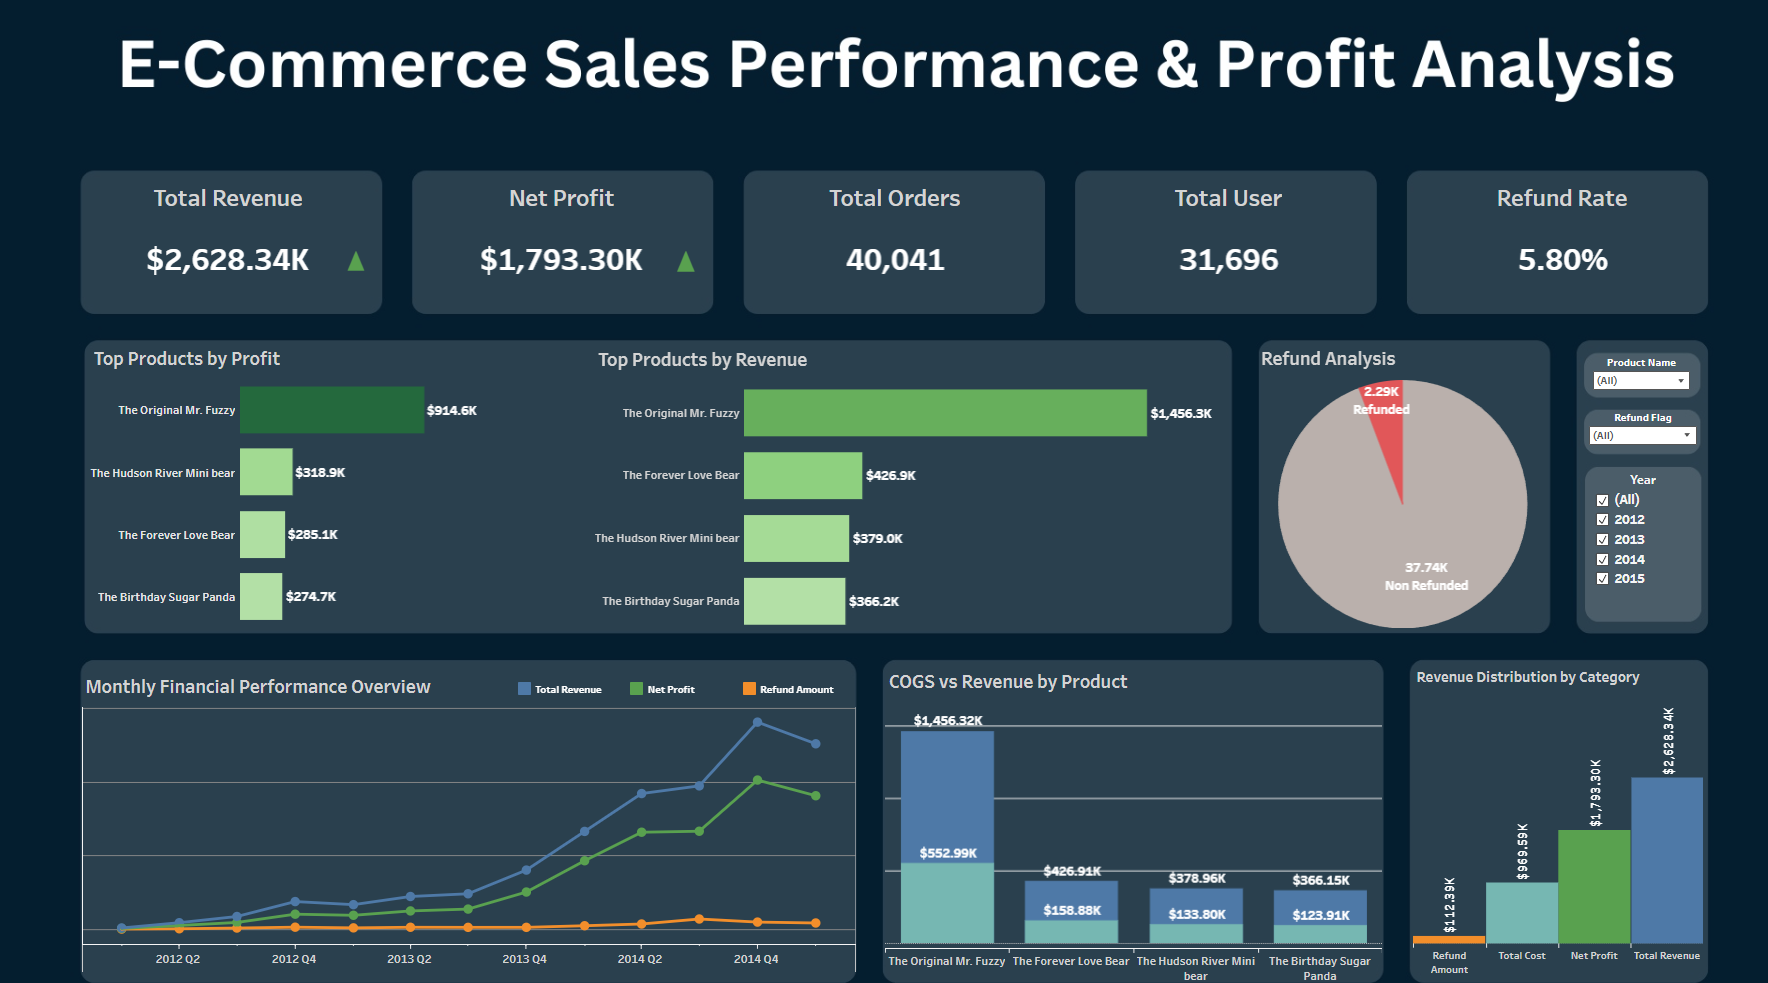
A complete Business Intelligence dashboard transforming raw transaction data into key metrics (Revenue, Net Profit, Orders, COGS, Refund Rate). Features interactive visualizations of monthly growth, product profitability, and refund trends to optimize spend.
I'm Kundan — a fresher Data Analyst who graduated with a BA (Hons) in Political Science from Delhi University in July 2024. My background isn't traditional tech, and I'm proud of that. Political Science sharpened my critical thinking, research instincts, and ability to turn complex information into clear, evidence-backed stories — a mindset that makes me a stronger analyst.
Right after graduation, I took charge of my own upskilling. I completed multiple online courses, earned industry certifications, and built hands-on data projects — all on my own. I have no corporate experience yet, but every project in this portfolio is real work I've done on real data.
💡 I may be a fresher, but I'm not inexperienced — I've been learning and building every single day since graduation.
From a Political Science classroom to building real data dashboards — here's how it happened.
Completed secondary school education with strong core subjects, building early analytical and quantitative foundations.
Completed senior secondary school education, developing solid skills in logical reasoning, math, and structured academic study.
Studied political theory, research methodology, and policy analysis. Developed critical thinking, complex system analysis, and evidence-based storytelling—foundations that translate directly to business intelligence and data analytics.
Realised that my love for patterns, research, and storytelling with facts perfectly matched the world of data. Made the bold decision to self-learn data analytics from scratch through online platforms like Coursera, Google, and YouTube.
Completed the Google Data Analytics Professional Certificate, learned Python, SQL, Power BI and Tableau through structured online courses and daily practice. Built 15+ real-world projects applying every concept learned.
As a fresher with no corporate experience, I've been building real projects on my own — analysing datasets, creating dashboards, and practising SQL queries daily. This portfolio is proof of my dedication. I'm actively looking for my first job opportunity where I can apply, grow, and contribute to a data-driven team.
Industry-recognized certifications validating my expertise.
LinkedIn Learning — Core data analytics foundations: data types, analysis process, and business decision-making with data.
LinkedIn Learning — Extending core analytics knowledge: advanced techniques, applying insights to real business scenarios.
IBM SkillsBuild — Covers foundational database concepts, SQL queries, table creation, joins, and relational database structures.
Athena Global Education / CIQ UK — Level 5 certification covering MS Excel formatting, data organization, formulas, referencing, and tables (Score: 92/100).
Hands-on Power BI training covering dashboard creation, DAX measures, data modelling and interactive reporting.
Certification covering data science and analytics methodologies — statistical thinking, data wrangling, and applied analysis.
LinkedIn Learning — Industry-focused skills: stakeholder communication, presenting findings, and professional data workflows.
Introduction to Artificial Intelligence concepts — machine learning basics, AI applications, and how AI intersects with data analytics.
Sun Foundation — 6-month comprehensive program completed with excellence, covering professional communication, life skills, and career readiness.
Techniques for communicating data insights effectively — data storytelling, chart selection, and presenting to non-technical audiences.
Professional presentation skills — structuring compelling narratives, visual design, and delivering insights with confidence.
Whether you have a project in mind, need a data audit, or just want to chat about analytics — my inbox is always open.